The Stakes of Market Sizing in Commercial Due Diligence
Overestimating market size is a leading cause of post-close deal failure. This guide explains how to build and verify TAM, SAM, and SOM models during commercial due diligence using robust, data-room-grounded methodologies.
In the high-stakes landscape of corporate transactions, commercial due diligence serves as the ultimate reality check for an investment thesis. At the heart of this evaluation lies market sizing due diligence, a rigorous process designed to verify whether a target company's addressable market can actually support its projected growth. For VC and PE fund investment professionals, relying on a seller's top-down, optimistic market forecasts is a primary driver of post-close value destruction. When deal teams fail to pressure-test these assumptions, they risk overestimating the available revenue headroom and overpaying for growth that cannot logically materialise.
The consequences of inadequate market validation are stark. Historical transaction research from McKinsey demonstrates that inadequate due diligence, particularly regarding market growth and competitive dynamics, negatively affects more than 40 percent of corporate transactions. When corporate M&A project leads rely on broad, unverified industry reports, they overlook structural deal risks such as market saturation, localized regulatory barriers, and shifting customer preferences. To safeguard capital and ensure predictable returns, modern investment teams must move beyond generic estimates and implement a granular, bottom-up validation of TAM (Total Addressable Market), SAM (Serviceable Addressable Market), and SOM (Serviceable Obtainable Market).
Structural Risks of Top-Down Market Estimates
Traditional market assessments often suffer from a major structural flaw: over-reliance on static, pitch-deck-style market definitions. These numbers are typically built on high-level, top-down assumptions that ignore operational realities. For example, a target company might claim a multi-billion-dollar market by applying a flat growth rate to a broad industry classification, without accounting for product-market fit or geographic limitations. This approach obscures critical risks that can quickly derail a business plan post-acquisition.
- Overestimating Revenue Headroom: Assuming that a rising tide will lift all boats, without validating if the target's specific product can address the broader market.
- Ignoring Competitor Density: Failing to isolate the market share already locked up by legacy players or fast-growing digital-native challengers.
- Misjudging Geographic and Regulatory Constraints: Overlooking localized compliance requirements or distribution barriers that restrict expansion.
- Failing to Isolate Non-Addressable Spend: Blending distinct budget categories together, which artificially inflates the target's true addressable wallet.
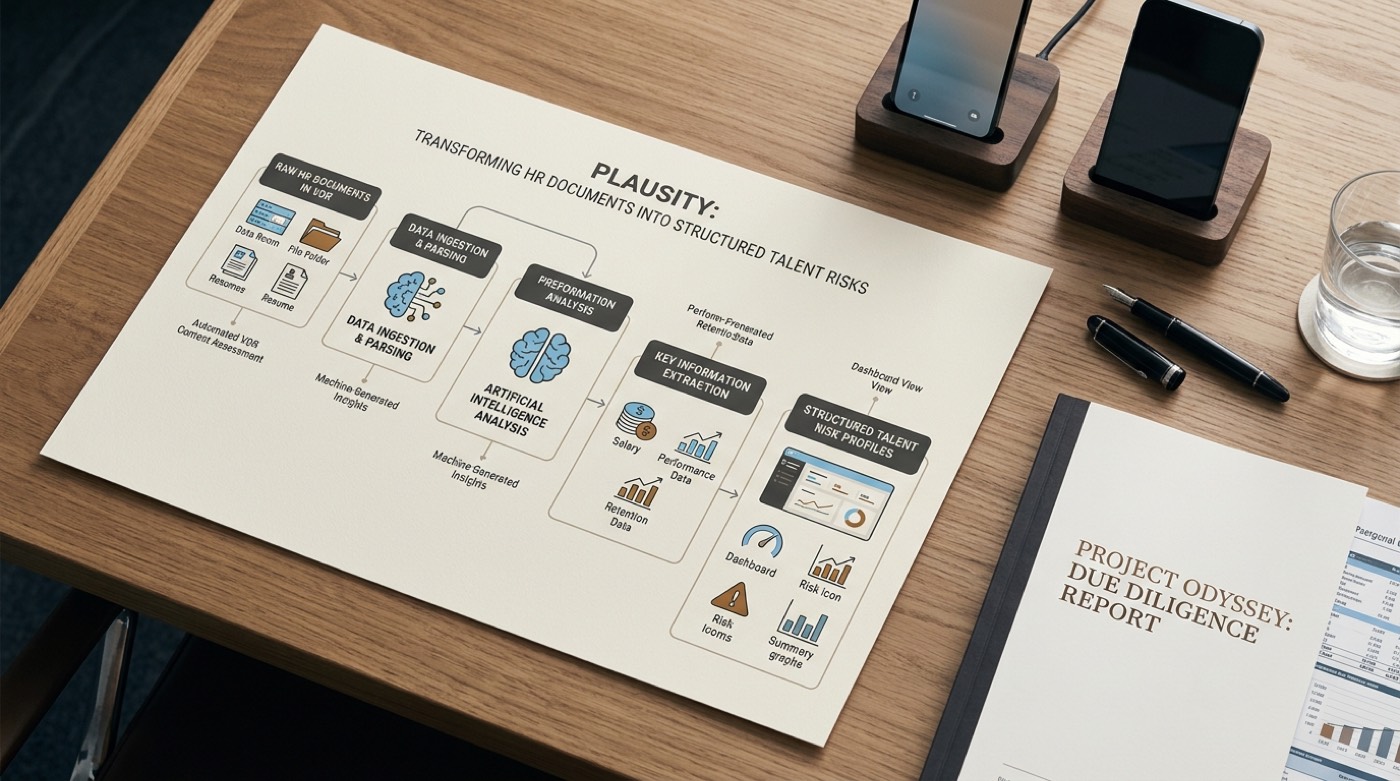
To mitigate these vulnerabilities, M&A advisory firm partners and analysts are increasingly restructuring their due diligence workstreams to prioritize data-grounded, bottom-up market sizing. By analyzing actual transaction records, customer contracts, and virtual data room documents, deal teams can extract raw data to verify market sizes from the ground up. This shift from passive review to active, data-driven validation is where modern technologies play a decisive role. For instance, platforms like Plausity use specialized tools like the AI-Analysis Engine to parse thousands of unstructured customer and market documents, allowing teams to cross-reference seller claims against empirical market evidence in a fraction of the traditional time.
TAM, SAM, and SOM: Demystifying the Market Sizing Taxonomy
In the highly competitive landscape of corporate acquisitions, overestimating the commercial runway of a target company is a classic deal failure mode. When VC & PE Fund Investment Professionals evaluate a potential transaction, verifying the target's market claims is a foundational step in end-to-end due diligence. Demystifying the traditional market sizing taxonomy (Total Addressable Market, Serviceable Addressable Market, and Serviceable Obtainable Market) through a strict commercial due diligence lens allows deal teams to separate marketing hype from verifiable revenue runways.
Total Addressable Market (TAM): The Theoretical Ceiling
The Total Addressable Market represents the absolute ceiling of market opportunity, defining the total potential revenue if the target company had 100% market share with no geographic or capacity constraints. According to the commercial due diligence framework outlined by PE Primer, mapping this absolute boundary is the starting point for testing an investment thesis. However, TAM is often the most abused metric in a virtual data room. Sellers frequently inflate TAM by including adjacent verticals that the target cannot actually serve, or by quoting aggregate global figures when the target operates in a highly localized market. Diligence advisors must treat TAM strictly as a theoretical upper limit, rather than an active sales pipeline.
Serviceable Addressable Market (SAM): Product and Geographic Realities
Serviceable Addressable Market narrows the focus by filtering TAM through the lens of current product capability and geographic reach. If a software target operates solely in Western Europe and lacks multi-currency support, its SAM is restricted to that region, regardless of how large the global software TAM is. During commercial due diligence, verifying the target's SAM requires analyzing product-fit realities, regulatory constraints, and localized market demand. It is the crucial middle layer that prevents sponsors from overestimating market headroom, which can severely damage the projected returns of a transaction.
Serviceable Obtainable Market (SOM): The Near-Term Capture Plan
The Serviceable Obtainable Market is the most critical metric for the immediate underwriting of the deal, representing the realistic market share the target can capture over a three to five year investment horizon. Unlike TAM and SAM, which are structural, SOM is highly operational, shaped by current sales force capacity, localized competitive intensity, and historical win-loss ratios. In a robust commercial due diligence process, the deal team must stress-test the target's sales projections. This means assessing whether the target's current sales reps can physically handle the volume of new customer acquisitions required to hit the SOM targets, or if the target is assuming unrealistic market share gains without a corresponding hiring plan.
| Market Layer | Diligence Core Focus | VDR Verification Sources | Key Red Flags to Uncover |
|---|---|---|---|
| TAM (Total Addressable) | Assessing overall macro trends and structural limits. | Industry analyst reports, regulatory registries, third-party databases. | Aggregating global numbers for a target with strictly localized operations. |
| SAM (Serviceable Addressable) | Filtering by current product fit, geography, and regulatory scope. | Customer rosters, active pipeline reports, localized product specifications. | Including market verticals that require massive, unbuilt product features. |
| SOM (Serviceable Obtainable) | Sizing the practical 3-to-5-year capture opportunity. | Sales team rosters, historical win-loss logs, regional competitor lists. | Projecting rapid customer acquisition without scaling sales head count. |
Historically, parsing and validating these metrics across thousands of data-room files was a manual and error-prone process. Modern deal teams are increasingly leveraging an AI-native due diligence platform to automate this workstream. By deploying Plausity's core AI-Analysis Engine alongside its automated Data Room Ingestion capabilities, investment professionals can instantly scan thousands of pages in a virtual data room, cross-reference market assumptions, and flag anomalies via the Risk Radar tool. This ensures that the TAM, SAM, and SOM figures presented by the sell side are thoroughly vetted against objective operational data before a single investment committee memo is drafted.
Top-Down vs. Bottom-Up Sizing: Choosing the Right Analytical Approach
Overestimating market headroom is one of the most critical deal failure points in mergers and acquisitions. When investment teams accept high-level market growth projections at face value, they risk overpaying for a business based on an inflated investment thesis. In modern transactional environments, verifying the market size requires a rigorous, systematic methodology to dissect total opportunity into practical, addressable segments. When conducting commercial due diligence, evaluating TAM (Total Addressable Market), SAM (Serviceable Available Market), and SOM (Serviceable Obtainable Market) is essential to validate growth potential. To do this effectively, investment professionals must choose between two primary analytical approaches: top-down and bottom-up sizing.
The Limits of Sell-Side Top-Down Reports
The top-down approach relies on aggregated industry databases, analyst reports, and macroeconomic research. While these sources provide helpful context on broad market trends and historical growth, they carry significant limits. Sell-side reports often use overly broad industry definitions that include unrelated products or customer segments, creating an artificially high baseline. For private equity and venture capital teams, relying solely on top-down estimates can lead to disastrous miscalculations, as these generic reports do not reflect the specific target's operational reality or geographical constraints.
The Power of Bottom-Up Triangulation
To protect investment theses and uncover critical risks, bottom-up triangulation has become the gold standard. A bottom-up model builds the market size from the ground up, using actual unit metrics such as customer counts, average contract value, transaction volume, or average order values. Instead of relying on external assumptions, this method forces the deal team to calculate demand based on observable customer segments and pricing tiers. Rather than sorting through scattered spreadsheets, modern deal teams utilize Data Room Ingestion to scan and process PDFs, customer contracts, and historical financial models from the virtual data room in minutes, creating a verified foundation for bottom-up calculation.
| Sizing Dimension | Top-Down Sizing | Bottom-Up Sizing |
|---|---|---|
| Primary data sources | Aggregated industry reports, analyst research, and macroeconomic databases. | Transactional data, target-specific unit metrics, and customer contracts. |
| Ideal use case | Initial market screening and understanding high-level sector trends. | Transaction-stage due diligence and validating specific growth theses. |
| Main risk | Overestimating the addressable headroom due to broad or generic definitions. | Requires deep access to granular customer and transaction data. |
| Execution speed | Extremely fast, often completed in hours using existing reports. | More time-intensive, requiring systematic extraction and data cleanup. |
| Strategic value | Provides macro context but lacks the precision needed for risk assessment. | Delivers a highly customized, defensible model of the actual target opportunity. |
Reconciling Both Methods for Deal-Ready Analysis
The most robust investment theses are built on triangulation, where top-down boundaries are validated or disproven by bottom-up reality. By comparing the macro-level industry data with the granular unit metrics extracted from the virtual data room, deal teams can pinpoint exact areas of friction. For instance, if a sell-side report claims a target's core market segment is growing at 15% annually, but bottom-up contract analysis shows flat average customer spend across key cohorts, a critical risk is revealed. Using an AI-native platform like Plausity, investment professionals can utilize the AI-Analysis Engine to automatically cross-reference raw document findings with high-level market sizing assumptions, ensuring every claim in the investment memorandum is fully grounded in transactional truth.
Reconciling Data Room Claims: Triangulating Market Sizing Models
Investment theses in venture capital, private equity, and corporate development frequently break down because of over-optimistic seller projections. Within a virtual data room (VDR), management presentations often paint an idealized picture of market headroom, blending adjacent markets, hiding customer churn, and assuming frictionless expansion. To protect the investment thesis, deal teams must shift from passive review to active triangulation, reconciling top-down marketing figures with bottom-up operational realities during commercial due diligence. Modern deal execution relies on tools like Plausity's Data Room Ingestion to rapidly parse complex market claims and cross-reference them against empirical files.
During market sizing due diligence, deal professionals often encounter a "sanity box" discrepancy where the seller's implied growth rates do not match broader macroeconomic realities. As outlined in the Umbrex commercial due diligence playbook, validating market claims requires checking the target's implied category size and growth against two independent outside-in series. By comparing top-down industry reports with a rigorous bottom-up build, investment teams can isolate variance and locate exactly where management's models have inflated their TAM, SAM, or SOM.
Detecting Common Red Flags in Seller Presentations
The primary source of error in management presentations is definition drift, which artificially inflates the addressable space. A common red flag is segment double-counting, where a target company counts a single prospective buyer or transaction value under multiple overlapping verticals. For instance, a software provider might list the same enterprise account in both their fintech and logistics TAM pools without adjusting for actual GTM capacity. To identify these issues, analysts must systematically cross-reference the customer lists provided in the VDR with external firmographic databases. By applying Plausity's AI-Analysis Engine, deal teams can automate this reconciliation, identifying duplicates and inconsistencies across multi-format data rooms in minutes.
| Management Presentation Claim | Due Diligence Red Flag | Triangulated CDD Reality |
|---|---|---|
| TAM covers the entire theoretical industry vertical without geographical or regulatory limitations. | Regulatory or localized product limitations are omitted, representing unserviceable markets. | Filter the TAM to a strict SAM by applying geographic, compliance, and near-term product-fit criteria. |
| Segment growth rates are tied to optimistic, generic industry compound annual growth rates (CAGRs). | Overlapping segments and double-counted customer accounts artificially multiply the target's market space. | Decompose growth into explicit drivers like category volume, pricing changes, and verified segment adoption. |
| The SOM assumes rapid market share expansion with nominal customer churn. | Historical churn rates are obscured or smoothed, masking product friction and market saturation. | Re-calculate SOM ranges by modeling actual historical customer churn and expected competitor responses. |
Practical Checklist: Bottom-Up Market Validation
To ground the target's Serviceable Obtainable Market (SOM) in reality, deal teams must execute a strict bottom-up validation protocol. This process moves beyond static slide decks to verify the actual unit economics, contract boundaries, and buyer cohorts that drive future revenue.
- Lock the Taxonomy: Define the category boundaries in writing, specifying all inclusions and exclusions of channels, geographies, and buyer personas.
- Audit the Customer Registry: Reconcile active customer counts in the billing logs with the firmographic profiles highlighted in the marketing deck to eliminate double-counting.
- Adjust for Churn and Compounding Loss: Model the impact of historical customer churn on forward-looking acquisition capacity, as a high customer attrition rate directly caps the target's reachable SOM.
- Isolate Future Options: Separate the target's core, proven market sizing from speculative expansions, treating adjacent segments as scenarios with distinct milestones rather than certainties.
- Identify Anomalies with AI: Deploy automated tools like Plausity's Risk Radar to run materiality-based anomaly checks across all operational and financial documents in the data room.
By automating the tedious work of cross-referencing and data structuring, an AI-native due diligence platform allows investment professionals to focus on high-value expert interviews and thesis-level strategic validation, converting raw virtual data rooms into deal-ready execution assets.
A Practical Checklist for Market Sizing in Commercial Due Diligence
Evaluating market headroom is a cornerstone of commercial due diligence and must be approached with skepticism. Overestimating market headroom is a critical deal failure point in private equity and venture capital. When evaluating a high-growth target, investment committees are often presented with aggressive market projections that gloss over competitive realities or structural limitations. Establishing a structured due diligence checklist allows deal teams to systematically dissect these claims within the virtual data room. Grounding the investment thesis in verified data, rather than accepting management's broad-brush figures, is the first step toward protecting downside risk and identifying the real commercial potential of a transaction.
Step 1: Define the Market and Segment Boundaries
The first step requires precise definition of the target company's market and segment boundaries. Rather than looking at a generic industry category, deal teams must isolate the target's addressable niche based on geography, customer size, and product fit. Commercial due diligence typically focuses on a standard five-year forecast horizon to match the typical private equity hold period. Over this timeline, defining narrow segment boundaries ensures that the Total Addressable Market (TAM) reflects realistic industry parameters rather than an inflated global figure.
Step 2: Choose the Build Method and Triangulate
To calculate the addressable market size, analysts choose between supply-side and demand-side build methods. A supply-side build aggregates the revenues of all active competitors in the target's space, while a demand-side build calculates the total potential spend of all target customers based on average order value or license price. Relying on a single method is a common pitfall; instead, deal teams must triangulate the market size by comparing both builds. If the bottom-up demand-side calculation diverges significantly from top-down competitor revenue data, it indicates underlying modeling errors or unvended market whitespace.
Step 3: Calculate Haircuts and Run Risk Scenarios
A robust market sizing model must apply realistic haircuts to account for regulatory trends, competitive entry, and technological shifts. For example, a target's Serviceable Obtainable Market (SOM) can shrink rapidly if new environmental or data protection standards restrict target customer groups. Deal teams must model scenarios where market penetration slows or average pricing declines. By building these haircuts into the five-year forecast, investors can stress-test the model to see if the target can still hit its growth targets under adverse conditions.
- Isolate target segment boundaries by geography, vertical, and buyer type to prevent market overestimation.
- Align the market analysis with a standard five-year holding period forecast timeline.
- Perform a top-down supply-side build by aggregating competitor revenues.
- Run a bottom-up demand-side build based on customer counts and average transaction sizes.
- Triangulate both builds to resolve discrepancy gaps and identify unvended whitespace.
- Apply structural haircuts for regulatory shifts, competitive dynamics, and pricing pressure.
Executing this thorough evaluation requires cross-referencing thousands of data points across the target's virtual data room. Plausity helps deal teams streamline this commercial due diligence process. By using Data Room Ingestion to parse complex PDF binders, spreadsheets, and commercial files, the platform extracts relevant segment data in minutes. The core AI-Analysis Engine then reasons over this data, identifying discrepancies between management's claims and external market studies. Rather than spending valuable hours manually auditing competitor revenues, investment professionals can rely on Risk Radar to highlight market sizing inconsistencies and use Report Builder to generate professional, investor-ready analysis with full source traceability.
Modernizing Market Diligence: How Plausity Accelerates Verification
In high-stakes transactions, overestimating market headroom is a critical deal failure point that frequently erodes post-acquisition value. Traditional commercial due diligence has long relied on static, expensive market studies to validate target assumptions. However, these reports are often compiled too late in the transaction cycle to influence key valuation models or deal structures. To protect investment hypotheses, corporate development teams and private equity firms must shift toward continuous, bottom-up validation of TAM (Total Addressable Market), SAM (Serviceable Addressable Market), and SOM (Serviceable Obtainable Market) directly within the virtual data room. This transition requires a new approach to market sizing due diligence, replacing slow advisory cycles with modern, automated validation techniques.
The Risk of Unverified Market Assumptions
A seminal McKinsey study highlights that conventional due diligence processes frequently fail to thoroughly evaluate target growth assumptions, leading to over-optimistic pricing and unrealistic market share projections. M&A advisory partners and analysts routinely receive target pitch decks asserting massive addressable markets, only to find those figures built on fragile, top-down generalizations. When deal teams cannot easily stress-test these claims, they risk acquiring businesses that have already capped their practical growth limits. Integrating an AI-native due diligence platform into the transaction workflow allows investment teams to move past paper-based estimates and interrogate market data dynamically.
How Plausity Streamlines Market Sizing Verification
Plausity transforms how deal teams verify target growth prospects by automating the ingest and analysis of unstructured market data. Through specialized due diligence services, Plausity provides a structured environment to run deep, bottom-up checks on target market sizing claims. First, Data Room Ingestion connects to the transaction's virtual data room, scanning thousands of pages of PDF market reports, industry databases, and competitor analyses within minutes. Instead of manually cross-referencing disparate files, analysts can immediately access a centralized repository of extracted market data.
Next, the AI-Analysis Engine evaluates this extracted data to identify structural anomalies and modeling gaps. For example, if a target company claims a SOM that implies capturing 80% of a highly fragmented industry segment, the engine automatically flags this growth projection as an outlier based on historical market trends and peer benchmarks. By cross-referencing internal transactional records with external sector forecasts, the engine ensures that the target's bottom-up revenue projections align with realistic market limits. Finally, the Report Builder automatically structures these analytical findings, generating a comprehensive, deal-ready report that links every conclusion directly back to its original source in the data room.
| Diligence Dimension | Traditional Consultancy Model | Plausity AI-Native Platform |
|---|---|---|
| Verification Speed | Takes weeks of manual analysis and desk research, often arriving near signing | Analyzes data room documents in minutes, enabling real-time valuation updates |
| Inconsistency Detection | Relies on manual spot-checks by analysts, leaving gaps in complex datasets | Automated scanning of all TAM and SAM references to flag modeling anomalies |
| Source Traceability | Static reports with high-level summaries and opaque citations | Dynamic findings linked directly to the underlying raw documents and spreadsheets |
Plausity brings AI-native analysis to this workstream. Explore how Plausity supports market sizing due diligence.