The Illusion of Growth: Why Top-Line Revenues Hide Churn Risk
Surface-level revenue growth often hides severe customer decay. In M&A, executing a deep customer due diligence churn analysis is vital to unmasking structural retention risks, validating revenue quality, and protecting transaction valuation before signing.
In the fast-paced landscape of software and recurring-revenue mergers and acquisitions (M&A), high-level financial metrics often act as a deceptive smokescreen. During the initial phases of buy-side evaluation, deal teams frequently rely on standard Quality of Earnings (QoE) reports. These reports highlight aggregate Monthly Recurring Revenue (MRR) and historical growth curves to demonstrate product-market fit and commercial momentum. However, looking solely at aggregate revenue trends can be incredibly deceptive. A target company can report an upward-sloping growth curve even as its underlying customer base is quietly collapsing. When new customer acquisition velocity temporarily outpaces customer attrition, the surface-level numbers paint a picture of health that masks structural decay.
The Compounding Penalty of Customer Churn
To appreciate the risk of acquiring a business with hidden attrition, transaction professionals must analyze how monthly churn compounds over time. A target company displaying a seemingly benign 5% monthly logo churn rate might not trigger immediate red flags in a high-level financial summary. However, when compiled mathematically, a 5% monthly churn rate compounds to lose roughly 46% of the customer base within a single calendar year. For VC & PE Fund Investment Professionals, this means they are effectively purchasing a leaky bucket. To sustain current revenue levels, the target must continuously acquire nearly half of its customer base anew every year, leading to unsustainably high customer acquisition costs and collapsing margins post-transaction.
Why Standard QoE Falls Short on Revenue Quality
Traditional accounting-focused QoE reviews are designed to verify the historical accuracy of cash flows and ensure revenue recognition policies comply with regulatory standards. While this validation is essential, it is inherently backward-looking and does not assess the durability of future cash flows. This is where integrating a structured due diligence checklist focused on revenue stability becomes indispensable. By conducting a granular customer due diligence churn analysis and dissecting the revenue stream by cohort, tenure, contract size, and product line, corporate development teams and advisors can verify the structural integrity of revenues and accurately price deal risk.
| Revenue Attribute | Standard Quality of Earnings Focus | Granular Churn Analysis Insight |
|---|---|---|
| Revenue Growth Trends | Tracks aggregate recurring revenue expansion and historic quarterly trends | Dissects expansion versus new bookings to see if growth masks underlying customer attrition |
| Customer Retention | Identifies top customer concentration and major logo dependencies | Tracks monthly and quarterly cohorts to identify precisely when and why accounts drop off |
| Unit Economic Viability | Calculates historical gross margins and operational expenses | Evaluates projected customer lifetime value against CAC based on real cohort survival curves |
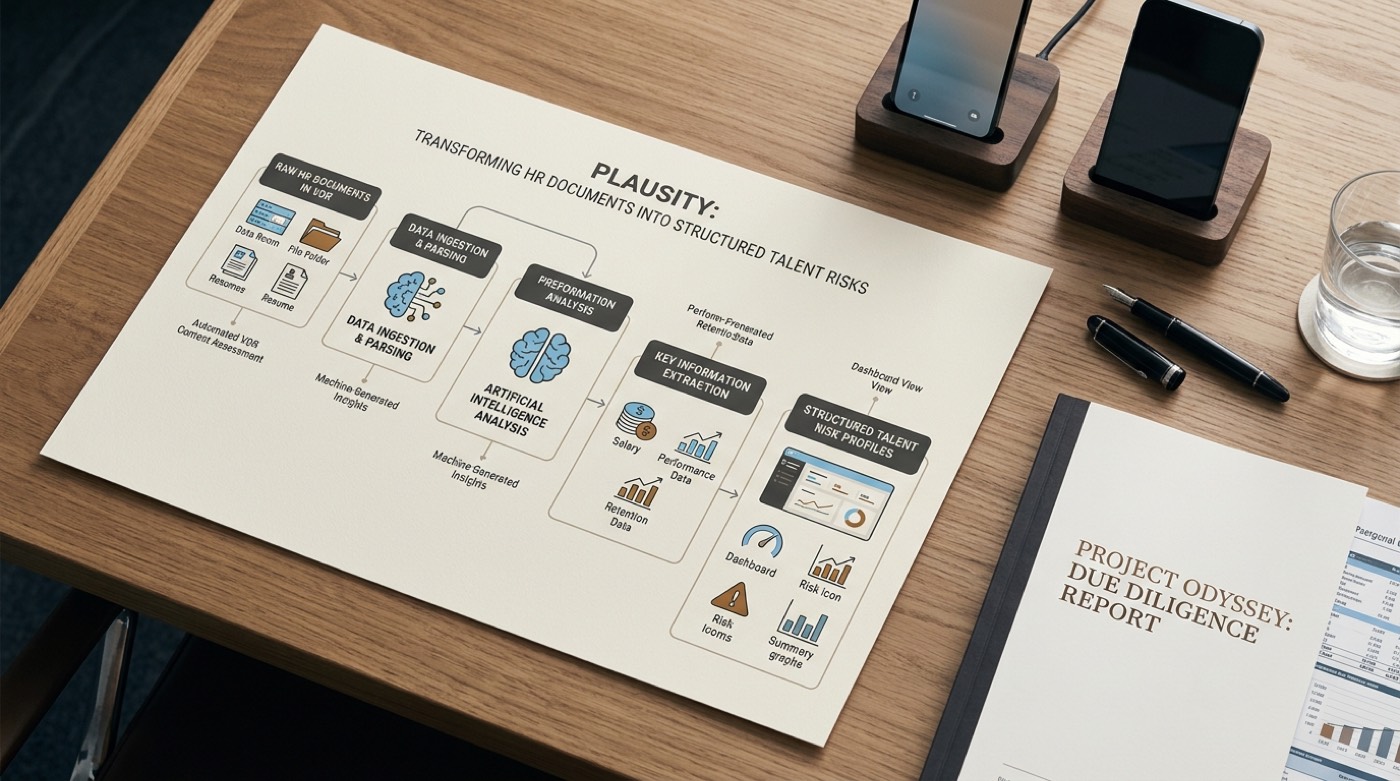
As deal professionals navigate the complex transactions of mergers and acquisitions, relying on manual spreadsheet models to perform these cohort calculations has become a major liability. Financial data rooms contain thousands of unstructured customer transaction logs, billing schedules, and CRM exports that are incredibly time-consuming to stitch together. To accelerate transaction timelines without sacrificing analytical depth, modern buy-side teams use Plausity to streamline the transition from a virtual data room to investment-committee report. Within this workflow, Plausity's Data Room Ingestion tool automatically scans and cleans raw transaction files, passing them directly to the AI-Analysis Engine to reconstruct precise vintage cohort tables in minutes.
Cohort Analysis: Deconstructing the Customer Datacube
In modern software and recurring-revenue transactions, high-level financials often obscure underlying customer decay. A target company might show stable aggregate Annual Recurring Revenue (ARR), but this surface-level health can mask severe underlying customer churn that is temporarily offset by aggressive new sales or pricing increases. For VC and PE fund investment professionals, performing a rigorous customer due diligence churn analysis is the only way to verify the structural integrity of these revenues. To achieve this, deal teams must look beyond standard flat spreadsheets and construct a three-dimensional customer datacube. By utilizing automated tools like Plausity's Data Room Ingestion, transaction teams can instantly extract, clean, and organize raw transactional logs from virtual data rooms, allowing the core AI-Analysis Engine to model customer behavior along multiple vectors simultaneously.
Deconstructing Vintages by Customer Size and Time
A standard cohort analysis breaks down a company's customer base into distinct groups, or vintages, based on the month or year they were acquired. Standard mid-market B2B software companies typically target a median annual logo churn of 4% to 5%. Analyzing these cohorts helps deal teams verify if older vintages remain stable or if they are decaying at an accelerating rate. If older cohorts show stable retention while newer cohorts exhibit rapid deterioration, it is a clear leading indicator that product-market fit is degrading or that customer success operations are failing to scale. Conversely, if newer cohorts display stronger initial retention, it proves the product is becoming more sticky and valuable over time.
Core Dimensions of the Customer Datacube Framework
- Temporal Vintage: Tracking retention over time by grouping customers by their exact acquisition quarter or year to analyze historical longevity.
- Customer Size and Tier: Segmenting cohorts by initial contract value to isolate mid-market and enterprise performance from high-churn small business segments.
- Product or Plan Type: Mapping cohorts against specific product versions or feature tiers to see if newer pricing structures improve or harm customer retention.
By slicing customer data across these three dimensions, M&A advisory firm partners and analysts can immediately spot where revenue quality is concentrated. For instance, Plausity's Risk Radar automatically highlights risks within the datacube, such as if a high-value customer segment within a 2024 vintage has experienced silent contraction that hasn't yet triggered a full contract cancellation. This level of granularity prevents buyers from paying a premium valuation for a business that is structurally leaky, even if the headline ARR figures look acceptable at first glance.
Ultimately, evaluating the customer datacube is an indispensable part of modern due diligence workstreams. By verifying retention at the cohort level, deal teams can confidently model future cash flows, negotiate appropriate valuation adjustments, and identify immediate post-acquisition levers for value creation. In an environment where software valuations are heavily tied to net revenue retention, having deep cohort clarity is a key differentiator that separates highly successful transactions from costly integration failures.
Distinguishing Logo Churn vs. Revenue Churn in Due Diligence
In modern software and recurring-revenue acquisitions, relying solely on top-line revenue growth can be highly deceptive. High-level financial statements often obscure underlying customer decay, leaving buyers vulnerable to post-transaction revenue drop-offs. To avoid this pitfall, sophisticated acquirers conduct a meticulous customer due diligence churn analysis. This specialized cohort investigation separates superficial financial metrics from actual product adoption trends, helping deal teams verify the structural integrity of recurring revenue streams before finalizing valuations.
When analyzing complex recurring revenue streams as part of critical due diligence workstreams, the core numbers must be split into logo churn and revenue churn. Logo churn tracks the absolute percentage of customers lost over a given period, reflecting basic customer satisfaction and product-market fit. In contrast, revenue churn measures the financial impact of those losses. Acquirers evaluate this using Gross Revenue Retention (GRR) and Net Revenue Retention (NRR). For mid-market B2B software targets, GRR should ideally sit around 94% to 95% to indicate high revenue quality. This high benchmark ensures that the target retains the vast majority of its core contract value before any expansion is factored in.
The Danger of Masked Product Decay
A common trap during due diligence is a healthy-looking Net Revenue Retention rate masking a severe customer retention issue. When a target company exhibits high logo churn alongside net negative revenue churn (meaning an NRR well over 100%), the underlying business may be in trouble. This dynamic occurs when a handful of large, existing accounts expand their spend significantly, which mathematically offsets the loss of dozens of smaller clients. While the short-term financials look robust, this pattern reveals major product adoption barriers, high customer concentration risks, and a shrinking market footprint that will eventually cap future expansion and growth.
To put these retention figures into perspective, look at how benchmarks scale across different company sizes. While early-stage firms often experience highly volatile retention rates, late-stage and mid-market companies must meet stricter efficiency standards to justify premium enterprise value multiples.
| Company Size (ARR) | Median Net Revenue Retention (NRR) | Median Gross Revenue Retention (GRR) |
|---|---|---|
| $1M - $10M | 98% | 85% |
| $10M - $50M | 105% | 88% |
| $50M - $100M | 110% | 92% |
| $100M+ | 115% | 94% |
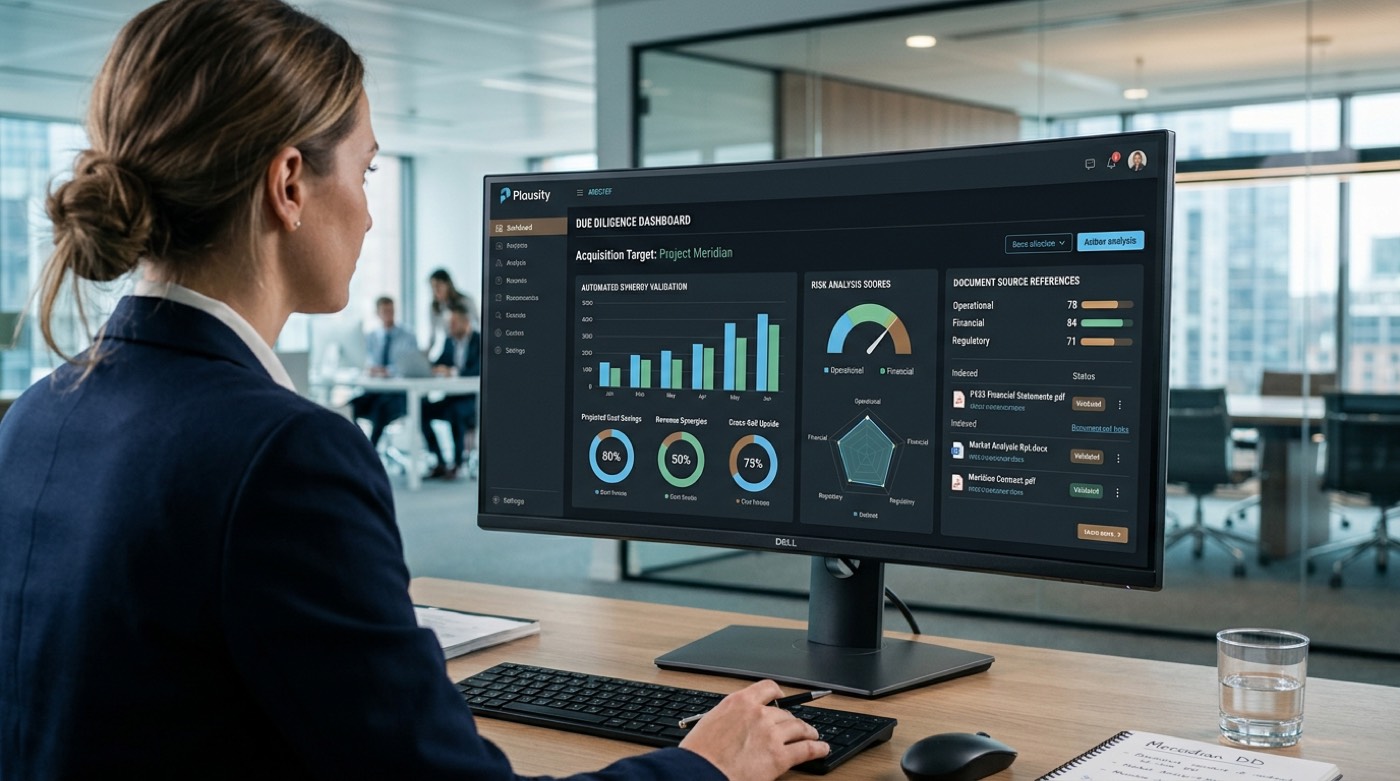
For VC/PE deal professionals performing due diligence for PE portfolios, uncovering these hidden dynamics manually is incredibly time-consuming, often requiring analysts to clean and reconstruct messy cohort data under tight timelines. Plausity transforms this workflow by deploying its AI-Analysis Engine alongside Data Room Ingestion tools. These features automatically ingest raw billing ledgers, customer contracts, and transaction databases from virtual data rooms, performing instant, error-free cohort and churn analyses. This enables M&A deal teams to quickly identify revenue concentration, accurately price deal risk, and verify quality of earnings within minutes.
The Valuation Impact: How Retention Dictates M&A Multiples
In modern recurring-revenue transactions, high-level financial metrics often obscure underlying customer decay. While a target company may boast strong year-over-year revenue growth, a leaking bucket of customer churn can severely erode the structural integrity of that revenue over time. Research from Bain & Company demonstrates that increasing customer retention rates by just 5% can expand overall business profitability by 25% to 95%. This exponential impact is why customer due diligence churn analysis sits at the absolute center of deal valuation frameworks, serving as an essential focus for due diligence for PE and VC teams. A business with flat top-line growth but exceptional retention is often a far healthier acquisition than one with rapid top-line growth fueled by inefficient, high-churn customer acquisition.
When customer retention drops, the lifetime value of a customer contracts while the customer acquisition cost remains high, compressing the return on capital. In mergers and acquisitions, buy-side teams use these dynamics to establish a realistic baseline for future performance. Instead of accepting management's optimistic, linear growth projections, analytical deal teams dig into transactional ledgers to construct historical cohort models. These models allow M&A advisory firm partners and analysts to determine if revenue growth is organic and sustainable or if it relies on an unsustainable acquisition treadmill that will soon taper off.
Adjusting Valuation Models and Downside Protections
To translate retention insights into valuation adjustments, buy-side professionals run rigorous downside scenarios that test how sensitive the target's Enterprise Value to Revenue multiple is to changing churn rates. For instance, if logo churn or Gross Revenue Retention shows a deteriorating trend, the buyer will typically demand structural protections in the transaction documents to shift the risk back to the seller. These mechanisms ensure that the purchase price reflects the true quality of the customer base at closing, safeguarding the buyer's capital against immediate post-deal revenue degradation.
- Purchase Price Adjustments: Linking a portion of the enterprise value to specific retention metrics measured at the transaction closing date.
- Performance-Based Earn-Outs: Structuring a significant percentage of the deal consideration to be paid only if the target company meets specific Net Revenue Retention targets over a twelve-to-twenty-four-month post-closing period.
- Indemnity Escrow Holdbacks: Keeping a designated percentage of the purchase price in an escrow account to cover losses if critical high-value accounts terminate their contracts shortly after the acquisition.
- Multiple Compression Offsets: Discounting the headline enterprise value to revenue multiple during negotiations to account for the increased replacement costs associated with a high-churn customer base.
Executing this level of deep cohort analysis manually used to require weeks of expensive financial modeling, often stretching deal timelines. Today, automated technology speeds up this workflow significantly. Utilizing AI-native due diligence platforms enables deal teams to quickly ingest and process raw data. For example, Plausity provides Data Room Ingestion to instantly scan and structure unstructured customer contracts, which are then analyzed by the AI-Analysis Engine to map out exact cohort lifespans. This allows Risk Radar to surface early indicators of churn, letting advisors address potential valuation issues before entering binding negotiations.
Customer Concentration and Contract Quality Checks
During a transaction, high-level financial metrics such as aggregate monthly recurring revenue (MRR) often obscure underlying customer decay. When private equity and venture capital investors evaluate a business, understanding the distribution of that revenue is critical. High customer concentration, where a small number of accounts represent a disproportionate share of the revenue, significantly amplifies the impact of post-acquisition churn. If a target company depends on three key enterprise clients for half of its revenue, the departure of just one account can turn a projected growth story into a distressed asset restructuring. Customer due diligence churn analysis must look beyond top-line stability to map exactly how revenue is distributed across the entire client portfolio.
Segmenting Churn Risk Profiles
Evaluating revenue quality requires deal teams to segment the customer base into distinct risk profiles. Churn dynamics vary dramatically between small and medium-sized businesses (SMBs), mid-market accounts, and large enterprises. While high logo churn is expected and manageable in the SMB segment, it indicates severe product-market fit issues or competitive displacement in the enterprise tier. For enterprise-grade platforms, a healthy monthly logo churn benchmark sits under 0.5%, translating to roughly 6% annual churn. Understanding where the target's customer segments fall relative to these industry benchmarks is a fundamental component of validating the target's financial model.
| Customer Segment | Healthy Monthly Logo Churn Benchmark | Key Risk Drivers during Deal Transitions | Due Diligence Focus Area |
|---|---|---|---|
| SMB | 3.0% to 5.0% | High baseline mortality, low switching barriers, and economic sensitivity. | Cohort retention curves and acquisition cost payback periods. |
| Mid-Market | 1.5% to 3.0% | Organizational restructuring, competitive feature comparison, and budget contraction. | Net revenue retention patterns and expansion pathways. |
| Enterprise | Under 0.5% | Key stakeholder departures, high-touch onboarding bottlenecks, and long procurement cycles. | Individual contract quality, renewal terms, and service level agreements. |
Auditing Underlying Contract Quality
SaaS contracts are not created equal, and verifying qualitative contract terms is as vital as measuring historical churn rates. Deal teams must audit the underlying terms in the virtual data room to assess true revenue stickiness. Key clauses to examine include renewal notice periods, which dictate how far in advance a customer must opt out, and termination-for-convenience clauses, which can allow clients to exit agreements without penalty before the contract term ends. Identifying auto-renewal mechanisms and multi-year commitments provides visibility into future cash flows and helps prevent sudden revenue drops immediately following transaction close.
In mid-market and enterprise transactions, manually reviewing hundreds of customer agreements to find these specific clauses is incredibly time-consuming. This is where Plausity's Data Room Ingestion and AI-Analysis Engine transform the workflow. By instantly scanning contract repositories, the Risk Radar flags hidden termination-for-convenience clauses, unusual renewal timelines, and highly concentrated accounts that present a post-deal liability. This automated intelligence allows investment professionals to confidently assess revenue quality, validate financial models, and negotiate deal terms based on precise contract-level data rather than high-level averages.
Accelerating Due Diligence with AI-Powered Analysis Frameworks
In software and recurring revenue transactions, high-level financial metrics often obscure underlying customer decay, making a rigorous customer due diligence churn analysis essential. Relying solely on historical averages or aggregate revenue numbers can lead to a mispriced deal, especially when logo churn or gross dollar retention issues are masked by expansion revenue. To protect capital and uncover the true quality of earnings, modern investment professionals must move beyond slow, spreadsheet-driven processes. By executing a structured due diligence checklist powered by AI, deal teams can systematically parse customer cohorts, verify revenue resilience, and establish a clear baseline for post-acquisition growth.
A Step-by-Step Modern Customer Due Diligence Framework
Executing a thorough customer due diligence churn analysis at deal speed requires a transition from manual verification to automated systems. Traditional processes often drag on for weeks because analyzing thousands of individual transaction lines, contract dates, and usage patterns is manually intensive. For private equity and venture capital professionals, this delay risks deal momentum. Modern AI-native diligence frameworks solve this by accelerating ingestion, processing raw transaction files, and identifying structural customer health anomalies in a fraction of the time.
- Step 1: Automated Data Ingestion. Streamline the initial audit by connecting directly to virtual data rooms and secure storage. The Data Room Ingestion tool scans hundreds of spreadsheets, customer contracts, and billing registers within minutes, ensuring all relevant billing records are extracted and formatted.
- Step 2: Granular Cohort Mapping. Use the AI-Analysis Engine to parse the raw customer transaction history. This isolates subscription start dates, contract values, renewals, and cancellations, allowing the system to map monthly recurring revenue cohorts and track historical retention patterns.
- Step 3: Automated Risk Evaluation. Run the extracted cohorts through the Risk Radar to identify material revenue anomalies. The system evaluates logo churn, gross dollar retention, and net dollar retention while highlighting customer concentration risks that could impact the transaction valuation.
- Step 4: Investor-Ready Reporting. Compile the analytical findings into a comprehensive report. The Report Builder structures cohort tables, risk matrices, and executive summaries, creating a professional, deal-ready report with full source traceability.
- Step 5: Real-Time Deal Alignment. Coordinate the workstream using the Collaboration Hub. This allows VC or PE investment professionals, corporate development leads, and advisory partners to review identified customer churn trends, assign tasks, and align on negotiation strategies in real time.
| Diligence Dimension | Traditional Manual Due Diligence | AI-Powered Due Diligence |
|---|---|---|
| Ingestion & Setup | Manual mapping of billing data, taking days or weeks to format raw spreadsheets. | Automated scanning via Data Room Ingestion, processing complex transaction logs in minutes. |
| Cohort & Trend Analysis | High-level summary reviews that often miss underlying logo or gross revenue churn patterns. | Deep-dive cohort parsing via AI-Analysis Engine, exposing exact decay points across customer segments. |
| Risk Detection | Reactive spot-checking of larger contracts, risking oversight of smaller, systemically weak accounts. | Proactive, multi-variable checks through Risk Radar to instantly identify customer concentration and churn risk. |
| Reporting & Output | Manual compilation of slide decks and spreadsheets, prone to transcription errors and delayed timelines. | Automated drafting via Report Builder with full source traceability, delivering structured findings instantly. |
Utilizing this structured, AI-assisted approach allows deal teams to execute a comprehensive customer due diligence churn analysis without sacrificing speed. By automating the intensive tasks of data normalization and cohort reconstruction, investment professionals can focus their energy on negotiating valuation adjustments and planning value creation strategies. In a highly competitive deal landscape, this level of precision and velocity represents a critical advantage for modern M&A decision-makers.
Plausity brings AI-native analysis to this workstream. Explore how Plausity supports customer due diligence churn analysis.