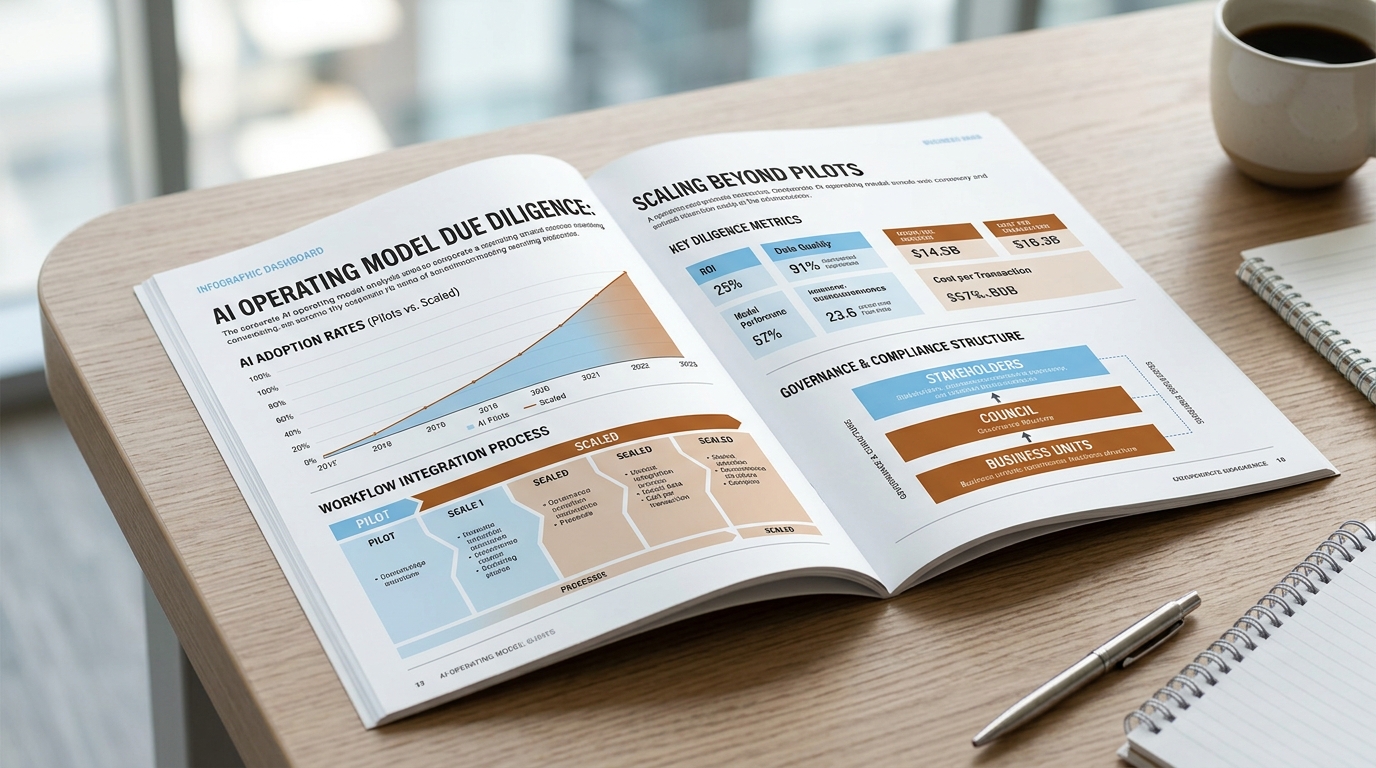
The AI Scaling Challenge for Investors
How do investors assess whether a company can scale AI? By looking past the technology and examining the operating model around it: whether AI initiatives are owned by accountable business leaders, embedded in redesigned workflows, governed with a defined review cadence, and measured against P&L lines rather than demo-day anecdotes. A target that has bought tools but not rewired how work gets done will show impressive pilots and flat economics. The one that can scale AI shows the opposite pattern: a small number of production-grade use cases, clear decision rights, and finance-validated value.
The stakes are asymmetric. PwC's AI Performance Study finds that 74% of AI's economic value is captured by just 20% of organisations, and that the leaders are distinguished not by tool count but by foundations: they are roughly twice as likely to redesign workflows to incorporate AI rather than simply adding AI tools, and they build stronger data, governance and trust mechanisms around the technology. In other words, the gap between AI leaders and the rest is an operating model gap, and it is exactly the gap a hold-period value-creation plan has to close.
For deal teams, the diligence question is therefore not "does the target use AI?" but "can management convert isolated experiments into a repeatable operating advantage during the hold?" That question spans strategy, leadership, data, technology, workflows, governance, talent, adoption, economics and outcomes. Each layer can be assessed, evidenced and scored, and the sections below provide the framework for doing so. The alternative, relying on management's pilot showcase, is expensive: industry research's CEO survey found that nearly two-thirds of companies pursue AI pilots, but only 26% have embedded AI as part of a broader business transformation.
- What to assess: whether AI is a board-level growth thesis with named executive ownership, or a collection of departmental experiments.
- Evidence to request: the AI strategy paper, investment committee minutes on AI spend, and the roadmap linking initiatives to value-creation milestones.
- What good looks like: a small portfolio of initiatives tied to strategic priorities, funded on a multi-year horizon.
- What bad looks like: a long list of proofs of concept with no graduation criteria, no owner above the IT function, and no defined P&L linkage.
- Misrepresentation to test: "we are AI-first" claims that dissolve into a slide deck with no budget lines, no decision rights and no named accountable executives.
Spotting Pilot Theatre vs. Genuine Capability
Pilot theatre is the disciplined-sounding version of AI inaction: a steady stream of demos, hackathon winners and press-friendly experiments, none of which ever carries production traffic or touches a P&L line. Genuine capability looks quieter. It shows up as a handful of use cases that graduated to production, are used daily by the population they were built for, and are tracked against financial baselines. The distinction is measurable, and a diligence process should measure it rather than take the demo tour.
Start with the graduation funnel. Ask for the total number of AI initiatives started in the last 24 months and the number that reached production with real users. A target running thirty pilots with two in production has a portfolio problem, not a technology problem. industry research's research underlines how rare real conversion is: more than half of CEOs cite the need to link AI initiatives to the P&L as a key barrier, but only 14% have clearly defined the P&L impact for all AI initiatives.
Then test adoption and repeatability. Adoption metrics such as daily and weekly active users across the intended user population reveal whether a deployed tool is part of the job or a side experiment; a licence deployed to 400 underwriters with 30 weekly users is a pilot wearing production clothes. Repeatable playbooks matter just as much: ask whether the second and third deployments reused the first deployment's patterns for data access, evaluation, human review and rollout, or whether every win was a one-off. industry research's survey work finds that strong performance management is closely linked to bottom-line effect, yet many organisations fail to track well-defined KPIs, making the presence of a real KPI dashboard a strong signal.
- Pilots started vs. graduated: the ratio of initiatives to production deployments with real users.
- Adoption: DAU/WAU across the intended user population, not licence counts.
- Impact: metrics tied to actual P&L lines, validated by finance, with pre-agreed baselines.
- Governance cadence: a regular safety and model review rhythm that production systems actually pass through.
- Repeatability: playbooks and reusable components, versus a portfolio of one-off wins.
Evaluating Strategy, Leadership, and Talent
The first layers of the framework are organisational, and they are where most value-creation plans are won or lost. Strategy asks whether AI is aimed at the two or three places it can change the economics of the business. Leadership asks who is accountable. Talent asks whether the people who must live with the systems can build, operate and challenge them. A target can fail any one of these and the technology layers will not save it.
Strategy and executive ownership
Evidence to request includes the AI strategy document, the org chart for AI and data roles, budget allocations by initiative, and the minutes of the executive forum that governs AI investment. Interview the CFO and at least two business-unit leaders, not only the CTO: if the business side cannot describe which AI initiatives matter to their P&L, ownership is nominal. industry research's analysis of what drives EBIT impact from generative AI found that CEO oversight of AI governance is one of the attributes most correlated with bottom-line results, which is why diligence should trace AI accountability all the way to the top of the org chart.
Talent and capability readiness
On talent, request the skills inventory, the reskilling plan, and attrition data for AI-critical roles. PwC's Global AI Jobs Barometer finds that jobs requiring specific AI skills are growing almost eight times faster than the overall jobs market and carry a 62% wage premium, which means a target's AI talent is both scarce and poachable; retention and development plans are therefore diligence material, not HR trivia.
- What good looks like: a cross-functional steering structure in which business-unit P&L owners co-sponsor AI initiatives, a named executive accountable for adoption, and role-based training tied to deployment milestones.
- What bad looks like: a siloed IT or data-science team driving AI without business-unit accountability, a strategy that exists only as an acquisition narrative, and an adoption plan that is a licence rollout rather than a workflow change.
- Misrepresentation to test: an "AI centre of excellence" that is a slide, not a funded team; a chief AI officer with no decision rights; training budgets announced but never spent.
Auditing Data, Technology, and Workflows
The middle layers of the framework determine whether the target's AI can move from a demo environment into the business. Data asks whether the inputs exist, are accessible and are governed. Technology asks whether the stack can support production workloads, evaluation and cost control. Workflows ask the decisive question: is AI embedded in how work actually gets done, or bolted on beside it?
Data and technology foundations
Evidence to request includes data architecture diagrams, the model inventory with versions and owners, system access for a guided walkthrough, the evaluation and monitoring approach for deployed models, and the roadmap for the next twelve months. In the data room, look for documentation of data lineage, access controls and quality measurement. Ask how models are evaluated before release and how drift is detected after; a target that cannot describe its evaluation process is running unmanaged risk, whatever its demos show.
Workflow integration
Workflow integration is where diligence earns its fee. industry research's survey work found that, of the 25 attributes tested, the redesign of workflows has the biggest effect on an organisation's ability to see EBIT impact from generative AI, yet only a minority of adopters have fundamentally redesigned their workflows. The practical test in interviews: pick a production use case and ask the frontline team to walk through their day before and after. If the AI tool sits beside the process and someone must remember to open it, adoption will decay. If the process itself was redesigned so the AI step is the path of least resistance, the use case is real. Deloitte's technology leadership study puts the structural point plainly: most executives (81%) say they can deploy and govern AI at scale today, yet nearly 75% acknowledge their operating model will need to change in the next 12 to 18 months to sustain progress.
- What good looks like: a maintained model inventory with owners and versions, documented data lineage, evaluation gates before release, monitoring after, and at least one workflow that was genuinely redesigned end-to-end around AI.
- What bad looks like: standalone tools procured by individual departments, no model inventory, evaluation by vibes, and "integration" that means a chat interface nobody is required to use.
- Misrepresentation to test: a demo environment presented as production; a "data platform" that is a shared drive; adoption numbers quoted as licences sold rather than active users.
- What good looks like: sustained active usage across the target group, with usage patterns that suggest the tool is essential to their daily workflow.
- What bad looks like: a spike in logins during launch week followed by rapid decay, leaving only a fraction of the intended users.
- Common misrepresentations to test: quoting total seats licensed rather than active users, or presenting pilot-group enthusiasm as broad adoption.
Adoption asks whether the business actually uses the tools deployed. What to assess is the daily and weekly active user count (DAU/WAU) across the intended population. Evidence to request includes usage dashboards, user support tickets, and drop-off rates over time.
Adoption and scaling
Assessing Governance, Economics, and Outcomes
The final layers test whether the AI operating model is safe and whether it pays. Governance asks who reviews models, how often, and with what authority to stop a release. Economics asks whether the value created justifies the compute, licence and management costs. Outcomes asks whether anyone outside the AI team can verify the results. These layers are where management narratives meet the general ledger, and where a disciplined process separates the two.
Governance and safety review cadence
Evidence to request includes the AI governance policy, the risk register for AI systems, minutes of the governance or review board, the incident log, and the approval matrix by risk tier. Ask for the last three model or use-case reviews and trace what changed as a result; a governance board that has never blocked or modified anything is a letterhead. PwC's AI Performance Study found that the leading companies are more likely to operate a Responsible AI framework and a cross-functional AI governance board, and that their employees are twice as likely to trust AI outputs, which links governance directly to adoption rather than treating it as overhead.
- What good looks like: a risk-tiered approval matrix, a regular review cadence with documented decisions, and an incident log with post-mortems.
- What bad looks like: governance as a policy document with no meetings, and no blocked releases.
- Common misrepresentations to test: a review board that exists only on paper and has never modified or halted a deployment.
Economics and financial value
On economics, what to assess is whether the value created justifies the compute, licence and management costs. Evidence to request includes value cases with baselines, the fully loaded cost model (including human review time), and finance sign-off. industry research's latest State of AI survey found that about 20% of respondents report AI-related operating costs constraining their AI use, and that only 37 percent attribute any EBIT impact to AI, so a target claiming broad financial impact must show its working.
- What good looks like: finance-validated baselines, with inference costs and returns tracked on a single ledger.
- What bad looks like: savings claims with no counterfactual baselines, and unbudgeted compute costs.
- Common misrepresentations to test: quoting productivity gains from vendor case studies rather than internal measurement, or ignoring human-in-the-loop costs.
- What good looks like: verified P&L impact for live use cases, and a repeatable playbook for data access and evaluation on the next project.
- What bad looks like: isolated one-off wins that share no infrastructure or lessons, and dashboards that no one outside the AI team audits.
- Common misrepresentations to test: claiming transformative business impact for isolated experiments that finance has not validated.
Outcomes ask whether the overall AI program is delivering verified P&L impact and building a foundation for future deployments. What to assess is the traceability of AI initiatives to bottom-line results and the reuse of components. Evidence to request includes KPI dashboards linked to the general ledger, and post-implementation reviews of deployed models.
Outcomes and repeatable playbooks
The AI Operating Model Diligence Scorecard
The framework compresses into a scorecard that can be scored during diligence and re-scored at 100 days and at each value-creation review. For each layer, request the listed evidence, score capability on a simple scale from pilot purgatory to production-grade, and record the specific artefact behind the score. The scorecard's value is less in any single row than in the pattern: strong technology with weak adoption and economics is the classic pilot-theatre signature, and it should drive the post-close plan.
| Layer | Evidence to request | Strong capability looks like | Red flags (pilot purgatory) |
|---|---|---|---|
| Strategy | AI strategy paper, investment minutes, initiative portfolio with funding horizons | Few high-value initiatives tied to strategic priorities, funded multi-year | Long PoC list, no graduation criteria, no strategic focus |
| Leadership | Org chart, decision-rights matrix, steering minutes, P&L-owner interviews | CEO or board oversees AI governance; business units co-sponsor initiatives | Siloed IT-driven AI, nominal chief AI officer, no business accountability |
| Data | Data architecture diagrams, lineage and quality documentation, access walkthrough | Catalogued, governed data with defined owners and quality metrics | Shared-drive data estate, unclear ownership, access bottlenecks |
| Technology | Model inventory, evaluation and monitoring approach, cost dashboard, roadmap | Versioned models with owners, release gates, drift monitoring, tracked costs | No model inventory, no evaluation process, unmanaged inference spend |
| Workflows | Process maps before/after, adoption plans, frontline interviews | At least one workflow redesigned end-to-end around AI | Tools bolted beside unchanged processes, optional usage |
| Governance | Governance policy, risk register, review-board minutes, incident log | Risk-tiered approvals, regular cadence, documented decisions and post-mortems | Policy without meetings, no blocked releases, no incident learning |
| Talent | Skills inventory, reskilling plan, attrition data for AI-critical roles | Role-based training tied to milestones, retention plan for scarce AI skills | Unfunded training promises, key-person dependency, rising attrition |
| Adoption | DAU/WAU by use case, user segmentation, support tickets | Active usage across the intended population, rising task completion | Licence counts quoted as adoption, decay after launch, shadow tooling |
| Economics | Value cases with baselines, fully loaded cost model, finance sign-off | Finance-validated baselines, costs and returns on one ledger | Vendor-quoted savings, unbudgeted compute, no counterfactual |
| Outcomes | KPI dashboards traced to P&L lines, post-implementation reviews | Verified P&L impact, repeatable playbook for the next deployment | Dashboards no one audits, one-off wins, no reuse between projects |
Executing Evidence-Backed AI Diligence
Running an AI impact due diligence framework manually across a live deal is a data problem before it is a judgement problem: model inventories, governance minutes, adoption dashboards and value cases are scattered through a data room in hundreds of documents, and the diligence window is short. This is where Plausity's platform fits. Data Room Ingestion connects to the VDR and processes PDFs, spreadsheets, contracts and financial models within minutes, so the evidence base for the scorecard exists from the first week rather than the last.
The AI-Analysis Engine then reads, cross-references and reasons over that material to test management's claims against the documents: whether the model inventory matches the roadmap, whether the value cases carry finance sign-off, whether the governance minutes show a real review cadence. Risk Radar evaluates the findings by materiality, financial impact and deal relevance, so the pilot-theatre signals surface as ranked risks rather than anecdotes. Report Builder drafts the deliverable with full source traceability, and Collaboration Hub keeps the deal team, advisors and workstreams aligned on one evidence-backed picture of the target's AI operating model. Seeing the engine work through a sample data room is the quickest way to judge how much of this framework it can automate on a live deal, and Plausity runs demonstrations for deal teams on request.
How Plausity accelerates this workflow
Plausity is an AI-native due diligence and deal intelligence workspace that helps M&A advisory firms, VC and PE funds, corporate development teams and investment-banking teams structure evidence, findings and questions across a data room. Plausity supports evidence extraction, source grounding, findings management and IC preparation — it does not replace human analysts, advisers or investment professionals, does not provide legal, tax, audit, regulatory or investment advice, and does not make autonomous investment decisions. All findings require human review. Built for today's investment and deal teams. Trusted by >200 firms.
To explore the underlying capabilities, see the Plausity AI analysis engine, the findings and risk intelligence and evidence gap detection product pages, and the IC memo product page. For team-level workflows, see how VC and PE funds and M&A advisory firms use Plausity across live deals, and how AI Impact due diligence and value creation workstreams support the analysis.