Why this matters now
In an era of intense capital scrutiny, financial due diligence separates durable investments from value-destroying transactions. With research from the CFA Institute indicating that between 70% and 90% of mergers and acquisitions fail to achieve their stated objectives, inadequate financial validation remains one of the primary drivers of post-close disappointment. When private equity sponsors, venture capital investors, and corporate development leads review an acquisition target or growth-stage company, the financial model is the core operational thesis expressed in numbers. If those numbers break under basic scrutiny, the entire deal logic collapses.
Experienced deal reviewers rarely spend hours parsing complex macro formulas on their initial pass. Instead, institutional investors run a systematic ten-minute triage to determine whether a target's financial model is built on defensible assumptions or speculative spreadsheet engineering. A single irreconcilable disconnect between the historical general ledger, the narrative in the management presentation, and projected revenue growth can kill an opportunity before the deal team incurs substantial third-party advisory fees.
The compounding cost of diligence blind spots
Overlooking operational and financial inconsistencies during early screening exposes buyers to severe downside risks. When revenue recognition anomalies, aggressive capitalization of routine expenses, or misjudged working capital requirements slip past initial triage, the downstream consequences are costly:
- Erosion of baseline returns: Post-close valuation write-downs occur when projected earnings before interest, taxes, depreciation, and amortization (EBITDA) fail to convert into free cash flow.
- Working capital deficits: Miscalculating the normalized working capital peg forces buyers to inject unplanned cash immediately after closing.
- Broken debt covenants: Overstated cash conversion ratios create immediate liquidity pressure under leveraged buyout (LBO) debt schedules.
- Wasted deal bandwidth: Deal teams spend weeks negotiating legal documentation on targets whose fundamental unit economics do not support the purchase price.
The main diligence framework
A rigorous financial model review requires transitioning from rapid headline screening to deep-dive validation. The objective is not merely to verify spreadsheet arithmetic, but to confirm whether reported and projected earnings reflect the economic reality of the business. According to transaction advisory guidance from Grant Thornton, a quality of earnings review goes beyond reported or audited statements to assess the sustainability, predictability, and cash-generating nature of earnings, whereas a statutory audit is primarily retrospective and compliance-driven.
To establish a defensible baseline, deal teams anchor their analysis in four foundational pillars: historical statement integrity, quality of earnings (QoE) bridge mechanics, cash conversion dynamics, and normalized working capital requirements. Reviewers evaluate these pillars against the broader due diligence checklist to isolate pro forma adjustments from core operating performance.
Core analytical pillars of the framework
- Historical Statement Reconciliation: Tying historical balance sheets, income statements, and cash flow statements directly to audited financials and tax filings.
- Quality of Earnings Bridge: Normalizing reported EBITDA by stripping out non-recurring revenue, one-off advisory costs, owner-related discretionary expenses, and temporary cost deferrals.
- Proof of Cash and Flow Dynamics: Reconciling reported operating income with actual cash collections through bank records to verify billing cut-off and accrual policies.
- Working Capital Peg Definition: Establishing a 12-month trailing baseline for accounts receivable, inventory, and accounts payable to determine net debt adjustments at close.
What investors, buyers, and advisers should test
When evaluating a financial model during the first ten minutes, institutional investors apply 30 discrete diagnostic checks across six operational categories. Each check tests a specific mechanical connection between management's operational claims and the balance sheet.
I. Revenue assumptions and growth logic
- 1. Top-Down vs. Bottom-Up Capacity: Verify whether projected revenue growth is supported by realistic sales rep quotas, hiring timelines, and verified pipeline capacity, rather than arbitrary percentage escalators.
- 2. Historical vs. Projected Trajectory: Check whether forward growth rates exceed historical compound annual growth rates (CAGR) without a verifiable operational catalyst.
- 3. Customer Concentration Risk: Calculate top-5 and top-10 customer revenue shares to ensure the loss of a key account does not derail forward baseline projections.
- 4. Expansion vs. New Logo Split: Test whether projected revenue expansion relies excessively on upselling existing accounts versus acquiring new logos in contested market segments.
- 5. Churn and Net Retention Integrity: Validate that gross churn and Net Revenue Retention (NRR) assumptions match cohort retention data in the underlying billing ledger.
- 6. Revenue Recognition and Cut-Off Timing: Confirm that multi-year contracts, upfront professional services, and milestone billings comply strictly with applicable revenue recognition standards.
II. Gross margin sustainability and unit economics
- 7. COGS Classification Integrity: Ensure direct delivery costs, customer support, hosting infrastructure, and payment processing fees are fully captured in Cost of Goods Sold (COGS) rather than buried in operating expenses.
- 8. Pricing Power and Discounting Curves: Cross-examine average selling prices (ASP) over time to identify hidden discounting patterns used to hit quarterly targets.
- 9. Infrastructure Scaling Step-Functions: Verify that hosting and compute expenses scale proportionally with user volume and data ingestion increases rather than flattening arbitrarily.
- 10. CAC and Payback Realism: Calculate Customer Acquisition Cost (CAC) by including fully loaded sales, marketing, and onboarding overhead against gross margin payback timelines.
- 11. Cohort Contribution Margins: Confirm that older customer cohorts demonstrate stable or expanding contribution margins after initial onboarding incentives expire.
III. Burn multiple, runway, and cash conversion
- 12. Net Burn Multiple Calibration: Calculate the ratio of net burn to net new annual recurring revenue (ARR) to assess the capital efficiency of growth.
- 13. True Zero-Cash Runway: Test cash balance depletion under flat revenue scenarios to isolate the exact date additional financing or cost reduction is required.
- 14. EBITDA-to-Operating Cash Flow Ratio: Reconcile adjusted EBITDA with cash from operations and flag persistently weak conversion as a sign of working capital leakage.
- 15. Intra-Year Cash Seasonality: Identify quarter-end cash troughs caused by annual bonus distributions, insurance renewals, or seasonal inventory builds.
- 16. CapEx vs. OpEx Boundary Integrity: Audit capitalized software development and maintenance expenses to ensure standard operating costs are not artificially inflating EBITDA.
IV. Working capital and balance sheet dynamics
- 17. Normalized Working Capital Peg: Establish a 12-month rolling average for working capital to prevent cash distortion caused by pre-deal payment deferrals.
- 18. Days Sales Outstanding (DSO) Aging: Review aged receivables to determine whether unbilled revenue or extended payment terms are masking collection issues.
- 19. Supplier Terms and DPO Trends: Verify that Days Payable Outstanding (DPO) has not been artificially stretched to preserve cash balances ahead of diligence.
- 20. Inventory Turnover and Obsolescence: Assess inventory valuation methodologies and reserve balances against slow-moving or obsolete stock.
- 21. Off-Balance-Sheet Commitments: Uncover operating lease obligations, equipment guarantees, deferred executive compensation, and pending litigation liabilities.
V. Hiring plan, operating expenses, and capacity
- 22. Fully Loaded Headcount Costing: Ensure personnel expense forecasts include employer payroll taxes, benefits, bonuses, recruiting fees, and workstation overhead.
- 23. Ramp Time and Quota Attainment: Confirm that new sales and engineering hires include realistic 3-to-6-month ramp periods with discounted initial quota assumptions.
- 24. G&A Operating Leverage Bounds: Audit general and administrative expense scaling to ensure compliance, legal, and HR budgets do not decline below market-standard percentages.
- 25. Marketing Channel Saturation: Check whether marginal customer acquisition costs increase as marketing spend expands into secondary and tertiary channels.
- 26. Wage Inflation and Retention Allowances: Verify that projected salary increases align with prevailing technical and regional labor market inflation rates.
VI. Downside cases, debt schedules, and exit coherence
- 27. Downside Case Sensitivity Integrity: Stress-test scenarios where revenue growth slows materially and gross margins contract, checking if the model adjusts variable costs dynamically or breaks cash covenants.
- 28. Debt Service and Fixed Charge Coverage: Calculate minimum Debt Service Coverage Ratios (DSCR) under rising base interest rates and delayed cash collections.
- 29. Maintenance CapEx Reinvestment: Ensure ongoing capital expenditures are sufficient to maintain core technological infrastructure and physical assets through the projected hold period.
- 30. Master Model and Data Room Reconciliation: Cross-check every headline figure across the pitch deck, confidential information memorandum (CIM), data room spreadsheets, and the master financial model.
Red-flag table
When financial models are constructed to meet valuation targets rather than reflect operating reality, specific structural anomalies appear. Detecting these warning signs early allows deal teams to pause negotiations, request corrective schedules, or adjust valuation multiples before capital is committed to an unsustainable value creation plan.
| Warning Sign / Red Flag | Underlying Structural Risk | Deal Impact & Recommended Action |
|---|---|---|
| Discrepancies Between Deck and Master Model | Lack of version control or intentional data manipulation across marketing materials and financial workbooks. | Halt financial review; issue a formal request for reconciled trailing twelve months (TTM) general ledger extracts. |
| Cosmetic Downside Scenarios | Management's 'downside case' trims growth only marginally without stress-testing cost structures or cash covenants. | Build an independent downside model with materially lower revenue and contracted margins to evaluate true insolvency risk. |
| Sudden Gross Margin Expansion | Projected gross margins expand 500-1000 basis points without documented supplier price breaks or structural shifts. | Recalculate historical gross margin trends by customer tier; eliminate speculative expansion from baseline valuation. |
| Flat G&A in High-Growth Projections | General and administrative costs remain static while revenue triples, ignoring corporate infrastructure overhead. | Add market-standard overhead escalators into the model before calculating terminal cash flows. |
| CapEx Capitalization of Routine Maintenance | Software maintenance and routine customer fixes are capitalized on the balance sheet to artificially inflate EBITDA. | Reclassify capitalized maintenance costs back into operating expenses; recalculate adjusted EBITDA baseline. |
| Stretched Payables Paired with Accelerating AR | Days Payable Outstanding increases sharply while Days Sales Outstanding deteriorates. | Adjust net debt calculations at close by the full amount of overdue payables to prevent day-one working capital deficit. |
Evidence checklist and data-room request list
Conducting a fast, reliable model audit requires immediate access to primary accounting records. Without raw source data, reviewers can only audit internal spreadsheet logic rather than underlying business performance. Deal teams should verify that the virtual data room contains complete evidence across all key financial dimensions.
Essential primary accounting records
- Audited Financial Statements: Minimum three years of audited balance sheets, income statements, and cash flow statements with accompanying auditor notes.
- Monthly Trial Balances: Trailing 24 to 36 months of detailed trial balances and general ledger extracts mapped to chart-of-accounts codes.
- Tax Filings and Assessments: Three years of federal, state, and local corporate tax returns alongside all pending tax authority audit correspondence.
- Customer-Level Revenue Schedules: Monthly revenue by customer, contract start and end dates, billing frequency, and gross churn records.
- Debt and Financing Instruments: Complete loan agreements, promissory notes, intercompany credit lines, and interest rate hedging contracts.
Supporting operational and commercial documentation
- Detailed Employee Roster: Anonymized payroll schedule detailing base salary, bonus structure, benefits, department allocation, and start dates.
- Vendor and Infrastructure Contracts: Top-20 supplier agreements, cloud hosting commitments (AWS, GCP, Azure), and software license schedules.
- Aged Accounts Receivable and Payable: Monthly aging reports (current, 30, 60, 90, 120+ days) with historic bad debt write-off schedules.
- Bank Statements and Proof of Cash: Trailing 12 months of primary operating bank account statements to verify cash reconciliation.
How Plausity supports the workflow
Modern transaction teams face tight deadlines and expanding virtual data rooms containing thousands of unstructured files. Plausity provides AI-powered software designed to assist investment professionals in streamlining data extraction, model verification, and cross-document reconciliation. The platform automates repetitive mechanical checks while preserving complete source traceability for deal analysts.
The workflow begins with Data Room Ingestion, which securely connects to virtual data rooms and ingests balance sheets, general ledgers, customer contracts, and complex financial models within minutes. Rather than manually copying cell formulas and verifying historical schedules, analysts use the platform to establish a unified data baseline across all uploaded documents.
Once files are ingested, the AI-Analysis Engine cross-references projections in the financial model against historical general ledger entries, customer billing files, and operational disclosures. The engine identifies inconsistencies between management assertions and source records, flagging discrepancies in revenue recognition, headcount growth schedules, and COGS classifications.
To protect the investment thesis, Risk Radar evaluates identified discrepancies based on financial materiality, margin impact, and deal relevance. By systematically surfacing anomalies in working capital trends, debt schedules, and customer concentration, the platform helps deal teams focus their confirmatory diligence on critical financial risks before making binding commitments.
How to use this in your next diligence workflow
Executing a disciplined financial model review requires structured coordination across the entire deal team. Integrating automated verification tools into your standard evaluation playbook ensures that every investment thesis is tested against empirical evidence rather than spreadsheet optimism.
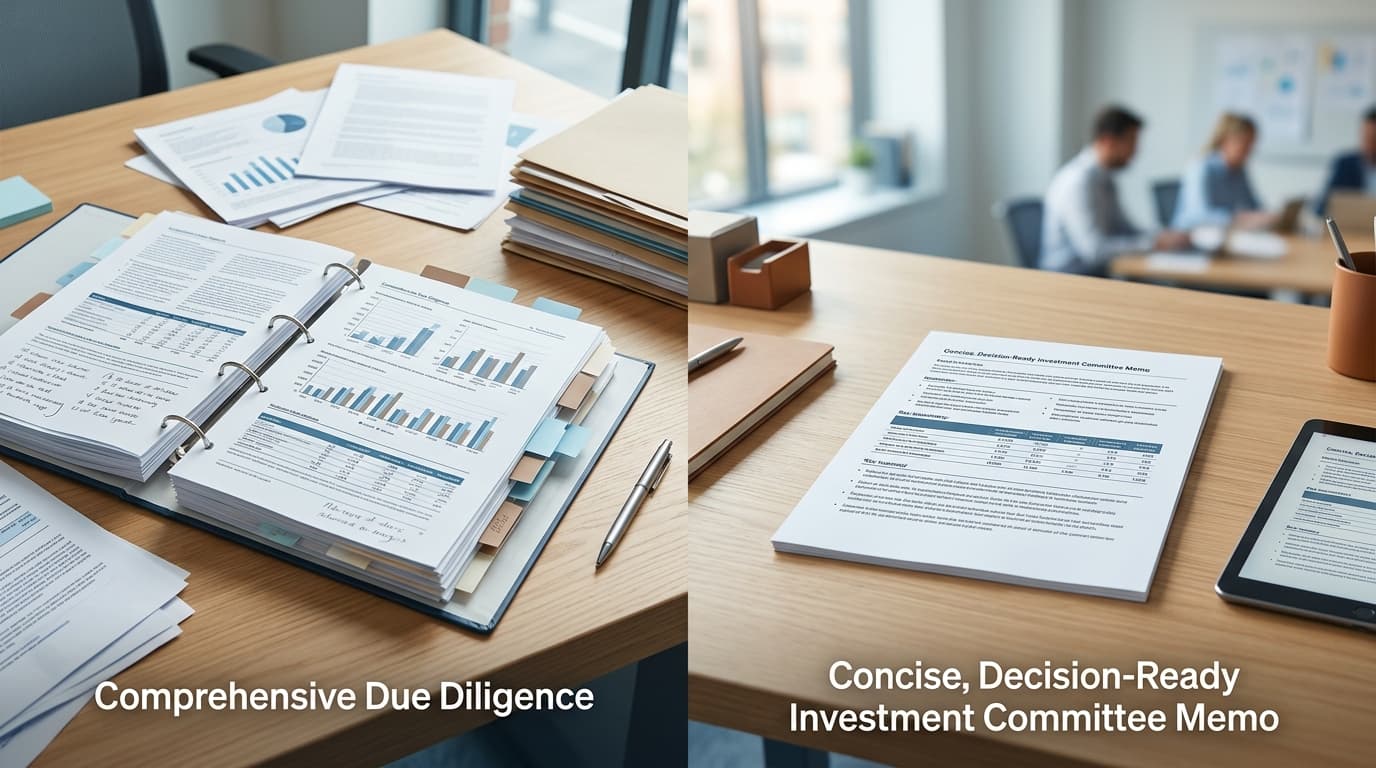
Deal leads can coordinate workstreams and share real-time findings using Collaboration Hub, keeping financial analysts, legal counsel, and operating partners aligned as new data room files arrive. When the financial review is complete, teams use Report Builder to automatically assemble structured, investor-ready investment committee memos with complete source attribution back to the target's primary data room records. By applying the 30-check framework and leveraging automated verification workflows, investment teams accelerate diligence velocity while protecting their portfolios against unpriced operational risks.